How did a storybook painting become the default thing to hang above a child's bed, and why are we, a studio that draws nursery charts from real data, suggesting it is the wrong default? The short answer is that the recommendation is a seventy-year accident of print technology, licensing deals, and mood-board culture, and the longer answer is a timeline. We draw four charts in this room — Dinosaurs to Scale, El Abecedario, O Alfabeto, and One to Ten — and each exists because the storybook-painting consensus leaves a specific wall doing nothing. This is how the consensus formed, and where it stopped making sense.
The 1950s: Storybook Illustration Moves From Book to Wall
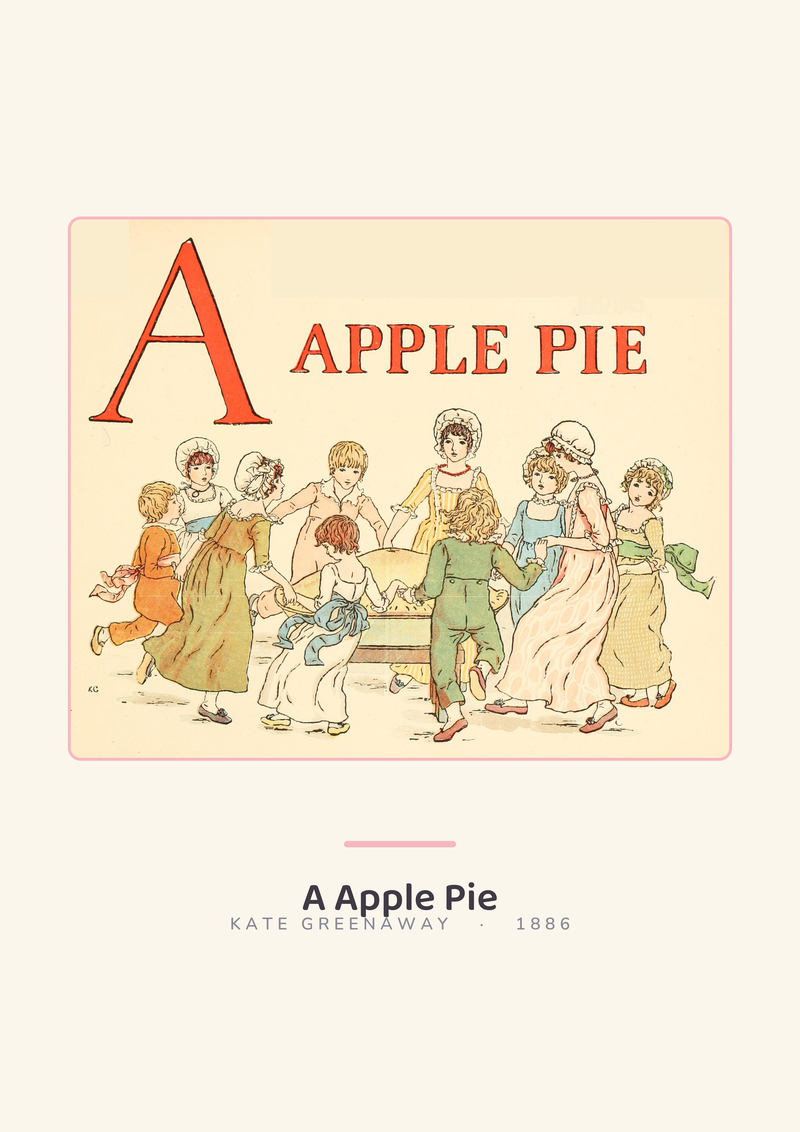
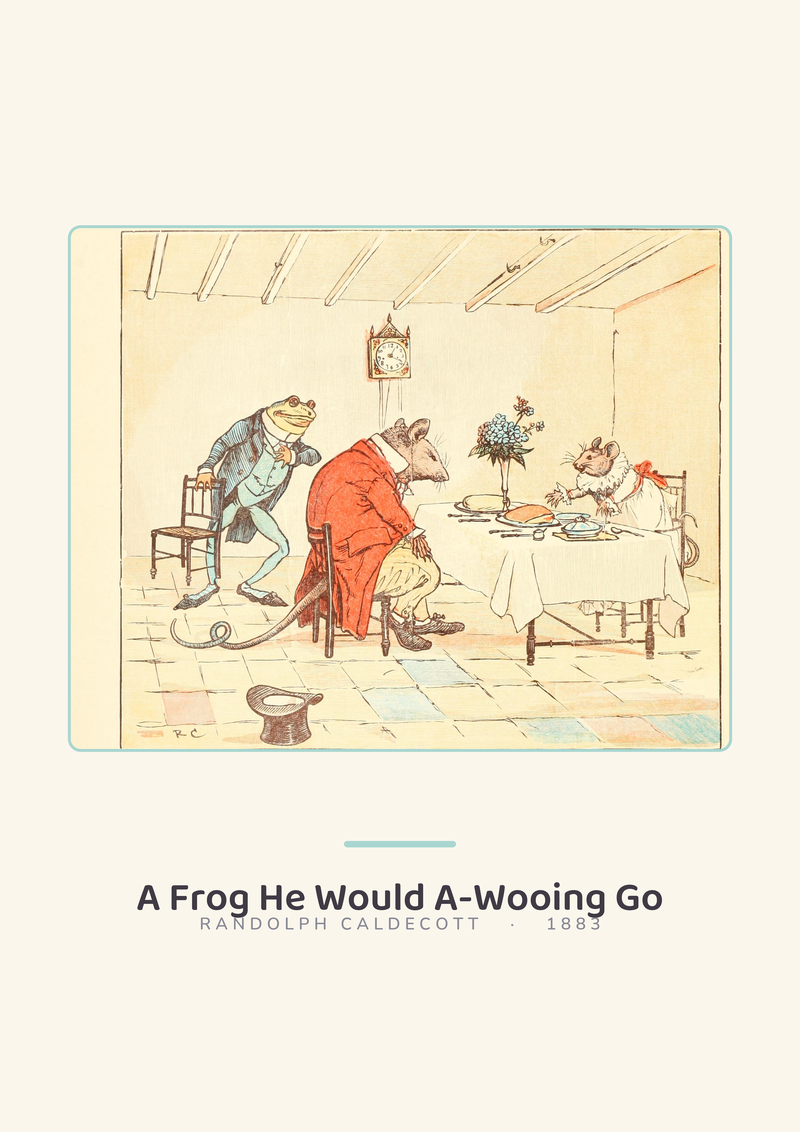
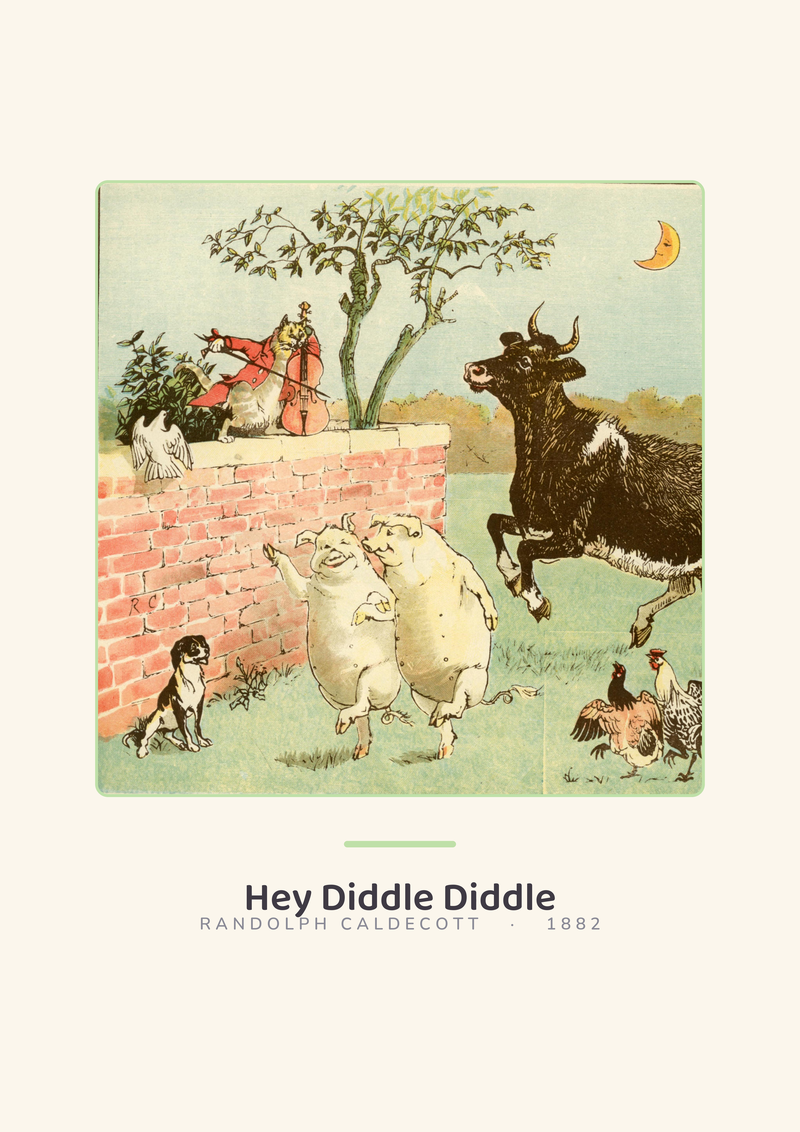
The idea that a painted scene from a children's book belongs enlarged on a nursery wall is younger than most readers assume. For most of the previous century, the walls above a child's cot held either nothing or a devotional print, and the illustrated storybook itself lived on a shelf, picked up and put down. What changed in the postwar years was lithographic colour printing becoming cheap enough that a publisher could sell the same artwork twice: once bound into a book, and a second time as a loose print trimmed to the size of a sheet of writing paper. Golden Books in the United States and the European equivalents began offering nursery prints as supplementary purchases, and the wall above a bed stopped being empty.
The reasoning on offer at the time was aesthetic rather than pedagogical. The pitch was that a child liked the picture, the parent liked the illustrator, and the frame tied the room together. That is a defensible pitch, and we would not argue with anyone who hangs an original watercolour of a hedgehog because the painting is beautiful. What we would push back on is the inheritance that followed. The idea took hold that this specific category of image — soft-focus, narrative, taken from a bound book — was the correct thing for a nursery wall, as if the wall had an obligation to look like a page. It did not. It had been empty, or devotional, or decorated with something else entirely, for most of recorded parenting. The 1950s print campaign was a commercial move dressed up as a convention, and the convention is what we inherited.
The 1990s: Licensed Characters Replace Original Painting
The second shift was a hollowing-out. By the late 1980s and through the 1990s, the storybook-painting-on-the-wall convention had been quietly repossessed by licensing departments. The hand-painted hedgehog became a cartoon hedgehog that already starred in a television programme, and the economics changed with it. The wall above the cot was no longer displaying an illustrator's work; it was displaying a trademark, with the illustrator's name — if there was still one on the file — reduced to a line in a contract.
This is where the recommendation starts to deserve the skeptical treatment. A licensed character on a nursery wall is not an aesthetic choice in the same sense a 1950s print was. It is a franchise impression, placed early, repeated often, and attached to a cross-sell. The books, the plushes, the lunchbox, the bedsheets, the birthday plates — the wall is the gateway to the catalogue. We are not moralising about this. We are pointing out that the advice, inherited uncritically from the 1950s, is being used by the 1990s to do something quite different: to turn the above-the-cot rectangle into shelf-space.
The craft argument also collapsed. A painted illustration printed well has texture, inked line, physical media; a licensed character printed in bulk is a vector of three flat colours flattened again by shrink-wrap. The wall above a cot is, in practice, viewed at a reading distance of about one metre by an adult holding a baby, and at about forty centimetres by a toddler who has climbed up to look. At those distances, the thin plastic reproduction loses to almost anything with care in it. The convention was holding. The content had moved.
The 2010s: The Nursery Mood Board and the Pinterest Shortcut
The next decade did something stranger: it turned the recommendation into a quiz. Pinterest went general-interest around 2012, Instagram's family and interiors community matured by about 2015, and the nursery acquired a visual grammar it had not previously had — pampas grass, muted earth tones, the ubiquitous arched mirror, and a storybook-style painting pinned to a specific board labelled with the room's chosen palette. The painting above the cot was now less about the painting and more about matching the three-swatch mood board the parent had assembled before the room was built.
We will say the quiet part loudly. In this decade the storybook painting became a template fill. The pin-worthy nursery had five obligatory elements, the above-the-cot artwork was one of them, and the question that mattered was not what was on the wall but whether it photographed well against the colour behind it. Entire categories of print appeared whose only argument for existing was that they fit the beige-and-sage board of 2017 or the warm-rust-and-cream board of 2019. The subject matter — a rabbit, a bear, a hot-air balloon — was interchangeable. The function was wallpaper that happened to be framed.
A child does not look at wallpaper. A child looks at things with internal structure — rows, letters, counts, scales, maps. The 2010s produced a nursery that had been designed for the parent's phone camera, and the above-the-cot rectangle had become the most prominent surface in the room on which nothing was being communicated to the person who actually lived in it. This is the gap the next decade walked into.
The 2020s: The Data Chart Enters the Nursery
The alternative was always there in schoolrooms and in old-fashioned bedrooms — the alphabet poster, the counting chart, the solar system diagram, the pull-down world map — but these had been exiled to classrooms and labelled, correctly, as educational materials that did not match the mood board. Early in the 2020s a quieter current pulled them back. Parents who had spent two years looking at the same four walls during lockdown started to ask what the wall was actually doing, and the honest answer was: not much. A chart does something. A chart has information on it that a two-year-old can point to and a six-year-old can read.
The design problem is non-trivial, which is why most of what gets sold as an educational chart is still bad. A classroom alphabet poster is drawn for a classroom: strong primaries, high-contrast outlines, letterforms engineered for a thirty-child cohort reading at the back of the room. A nursery chart has to work at a reading distance of about one metre, against softer walls, next to a cot or a changing table, with a palette that an adult will still want to look at in year five. The content is the data. The design is the room. The two have usually been treated as the same problem by whoever made the file, and the result is either information set in Comic Sans against a lime background, or a decorative poster with the letters moved around for prettiness and the pedagogy gone.
The 2020s is when a small number of studios — ours included — started treating the two problems separately. The letters are the real alphabet in the real language. The dinosaurs are drawn to the commonly cited body lengths. The dots on a counting chart are the right count. The colours are nursery-appropriate pastels. The vector linework is original, which is a quiet way of saying the file was not stolen off a stock marketplace and that no licensed character is doing invisible royalty work in the background. The chart stops being a classroom import and starts being a wall object with a job.
2024 to 2026: Three Languages, Seven Dinosaurs, Ten Dots
The last two years is where our own catalogue sits, and we will describe it concretely rather than in the abstract. The four charts drawn for this room are Dinosaurs to Scale, El Abecedario, O Alfabeto, and One to Ten. Each is an original vector drawing. Each has a specific job. None of them is a storybook painting.
Dinosaurs to Scale is seven dinosaurs drawn at real relative size next to a person, using commonly cited palaeontology length estimates. The point of the chart is not the dinosaurs considered individually; the point is the ratio. A child who looks at the chart for ten seconds learns that one of these animals is roughly twice the length of another, and that the person on the right is a dot next to any of them. A storybook painting of a smiling diplodocus does not do that. The scale does.
El Abecedario is a Spanish alphabet chart, every letter present, each tied to a friendly word, drawn in soft pastels. O Alfabeto is the same discipline applied to Portuguese, which has its own letters and its own first-word choices, and is not a translation of the Spanish file. One to Ten is a counting chart where the dots match the numeral — not a decorative row, a verifiable count, which is the entire point of a counting chart and the thing most of them get wrong. Three of these charts are language and number work. One is a scale lesson that works before the child reads at all. None of them pretends to be anything other than what it is: an original vector drawing of real information, printed for a wall above a bed or a changing table. If you want to see the room they were drawn for, they are at /shop/, and that is the only commercial pointer in this piece.
What It All Means
The storybook painting above the cot is a seventy-year inheritance built from a 1950s print innovation, a 1990s licensing takeover, and a 2010s mood-board flattening. Each of those decades had its own commercial logic, and none of them asked the question we think is the right one, which is what the child in the room is being given by the rectangle on the wall. The honest answer, for most of the inherited default, is: not much.
We are not against painting. A beautiful original watercolour, hung because it is beautiful, is a defensible answer and we will not argue against it. What we will argue against is the automatic recommendation — the Pinterest-first, licensing-second, book-illustration-third default — being handed down as if it were obvious. It is not obvious. It is a template. It survived because it photographs well and because the supply chain already existed, not because it is the best use of the wall.
The alternative we would propose is specific and small. A nursery wall can carry a chart that is drawn from real data, in a palette that fits the room, with content that outgrows a one-year-old slowly and a six-year-old finally. That is what the four charts in this room are for. If none of them fits the room, hang the beautiful watercolour. But do not hang the beige rabbit because a mood board required a rabbit. The wall deserves a job.
FAQ
What should actually go above a cot if not a storybook painting?
Something with internal structure the child can decode as they grow — an alphabet chart in the family's language, a counting chart with verifiable dots, a scale chart like dinosaurs or planets drawn to real relative size. The test is whether a two-year-old can point at it and a six-year-old can read it. A storybook painting fails the second half of that test, which is why the above-cot wall usually goes quiet by age three.
Is there any evidence that charts belong on a nursery wall rather than paintings?
We will not pretend to cite developmental research — that is not our desk and we do not do number-waving. The argument is design-side, not clinical. A chart has structured content that holds up to repeated looking; a decorative painting is often resolved on the first look. We draw charts because they give the wall a job that lasts, not because we are claiming measurable outcomes.
How large should an above-cot chart be to actually work?
Reading distance matters more than square footage. An adult holds a baby at roughly one metre from the wall; a toddler who has climbed up gets within forty centimetres. A chart with legible letterforms or scaled figures needs enough size that the smallest element — a letter, a dot, a figure on a scale strip — is readable at a metre. For our charts that is typically A2 or larger, framed with a reasonable mat.
Do licensed-character prints really do no educational work?
They do the work the licence pays them to do, which is register the character. That is a legitimate aesthetic choice if the family loves the show, but it is not the same as an alphabet chart or a scale chart doing content work. The honest framing is that the licensed print is a franchise object with a frame around it, and the above-cot wall can carry one of those or carry information, but it is a different decision.
Will the child outgrow a chart faster than a painting?
Opposite, in practice. A painting with a single subject is resolved early and goes invisible by about age three. A chart with letters, counts or scales keeps surfacing new information as reading develops — the letter the child cannot yet name becomes the letter they can trace becomes the first word they recognise. Our charts are drawn to still have something to offer at age eight, which is the honest upper edge we design to.
Why would we hang an alphabet in a language we do not speak?
Because the alphabet is a design object as well as a language object, and because a bilingual household — or a household that hopes a child will one day read a second language — benefits from the second alphabet being familiar on the wall before it is strange on a page. El Abecedario and O Alfabeto exist for exactly that reason, drawn separately rather than as translations of each other, because Spanish and Portuguese do not share the same letter list.
Does the studio sell storybook paintings as well?
No. We draw original vector charts from real data — the alphabets, the counting chart, the dinosaurs to scale, the planets from the NASA fact sheet, the world map from Natural Earth. If a reader wants a storybook painting, we would send them to an illustrator who paints originals. Our shop at /shop/ is only the charts.
Where does the data on the dinosaur chart come from?
From commonly cited palaeontology length estimates for the seven species on the chart, drawn at real relative scale against a person figure. We do not invent lengths and we do not treat scientific disagreement as settled; where estimates vary meaningfully we pick a conservative mid-range value and keep the ratios honest. The point of the chart is the ratio between the animals, and that ratio holds up across the credible length ranges in the literature.
From the collection
New nursery prints and 10% off your first order.
One email now with your code. No noise after.